
Aspiring to navigate the dynamic world of stock market trading? This comprehensive guide, “Stock Market Essentials: Insights for Aspiring Traders,” provides foundational knowledge for beginners. Learn essential trading strategies, understand market analysis techniques, and discover how to mitigate investment risks. Whether you’re interested in day trading, long-term investing, or simply want to build wealth through the stock market, this article offers invaluable insights to empower your journey.
Stock Market 101

The stock market is a marketplace where shares of publicly traded companies are bought and sold. These shares, or stocks, represent ownership in a company.
Investing in the stock market involves buying stocks with the expectation that their value will increase over time, allowing you to sell them for a profit. Conversely, a decrease in value results in a loss.
There are two main types of stock markets: the primary market, where companies initially issue shares, and the secondary market, where existing shares are traded between investors. The latter is where most individual investors participate.
Understanding risk is paramount. Stock prices fluctuate constantly due to various factors including company performance, economic conditions, and investor sentiment. High potential returns often come with higher risk.
Diversification, spreading your investments across different stocks and asset classes, helps mitigate risk. It’s crucial to conduct thorough research before investing in any stock.
Before diving in, consider learning the basics of financial analysis, understanding different investment strategies, and perhaps seeking guidance from a qualified financial advisor.
Fundamental Analysis
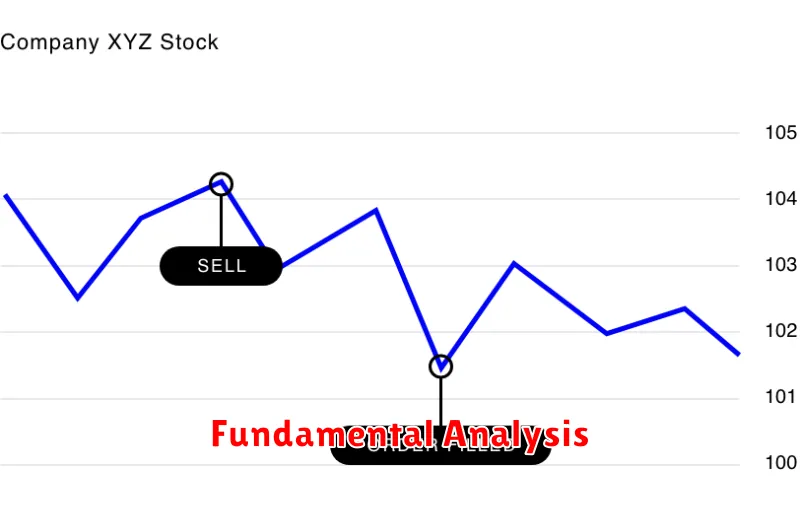
Fundamental analysis is a crucial aspect of stock market investing, focusing on evaluating the intrinsic value of a company. Unlike technical analysis which examines price and volume trends, fundamental analysis delves into a company’s financial health and future prospects.
Key metrics analyzed include revenue growth, profitability (e.g., net income, earnings per share), debt levels, and cash flow. Analyzing these factors helps investors determine if a company’s stock price accurately reflects its true worth.
Investors often use ratios such as the Price-to-Earnings ratio (P/E) and the return on equity (ROE) to compare companies within the same industry and assess their relative valuation. A thorough understanding of a company’s business model, competitive landscape, and management team is also essential.
By combining quantitative data with qualitative insights, fundamental analysts aim to identify undervalued or overvalued stocks. This process requires diligence and a comprehensive understanding of financial statements and accounting principles. It’s a vital skill for making informed investment decisions.
Technical Analysis Tools

Technical analysis relies on chart patterns and indicators to predict future price movements. These tools help traders identify potential support and resistance levels, trendlines, and momentum shifts.
Moving averages (MA) smooth out price fluctuations, revealing underlying trends. Relative Strength Index (RSI) and MACD (Moving Average Convergence Divergence) are popular momentum oscillators, signaling overbought or oversold conditions. Bollinger Bands measure price volatility and potential reversals.
Candlestick charts provide detailed information on price action within specific timeframes. Identifying patterns like hammer, hanging man, or engulfing patterns can offer insights into potential trend changes. Fibonacci retracement levels help identify potential support and resistance areas based on historical price swings.
While technical analysis tools are valuable, it’s crucial to remember they are not foolproof. Combining technical analysis with fundamental analysis and risk management strategies is essential for successful trading.
Market Sentiment and Trends
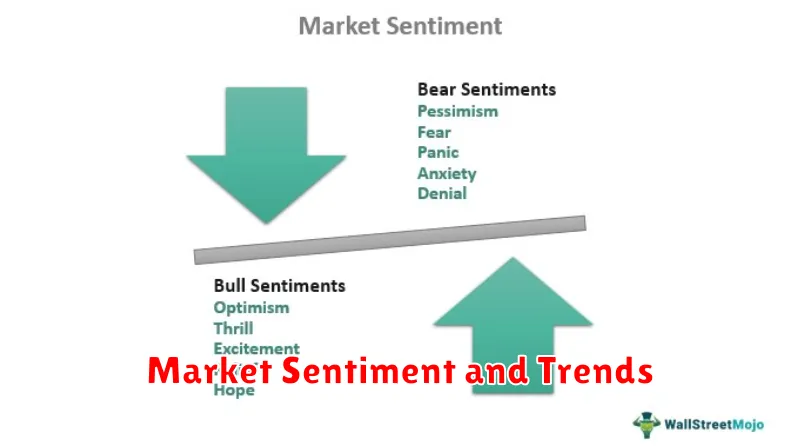
Understanding market sentiment is crucial for aspiring traders. It reflects the overall feeling of investors towards the market – optimistic, pessimistic, or neutral. This sentiment is often reflected in price movements, volume, and volatility.
Trends, on the other hand, represent the direction of price movements over a specific period. Identifying uptrends (prices consistently rising), downtrends (prices consistently falling), or sideways trends (prices fluctuating within a range) is essential for making informed trading decisions.
Analyzing market sentiment and trends involves studying various indicators. These include news events, economic data, social media sentiment, and technical indicators like moving averages and relative strength index (RSI). Combining these analyses provides a more comprehensive view of the market.
Recognizing shifts in sentiment and identifying emerging trends early can offer significant trading advantages. However, it’s crucial to remember that market sentiment can be volatile and unpredictable, and trends can reverse unexpectedly. Therefore, risk management strategies are paramount.
Risk Assessment in Trading
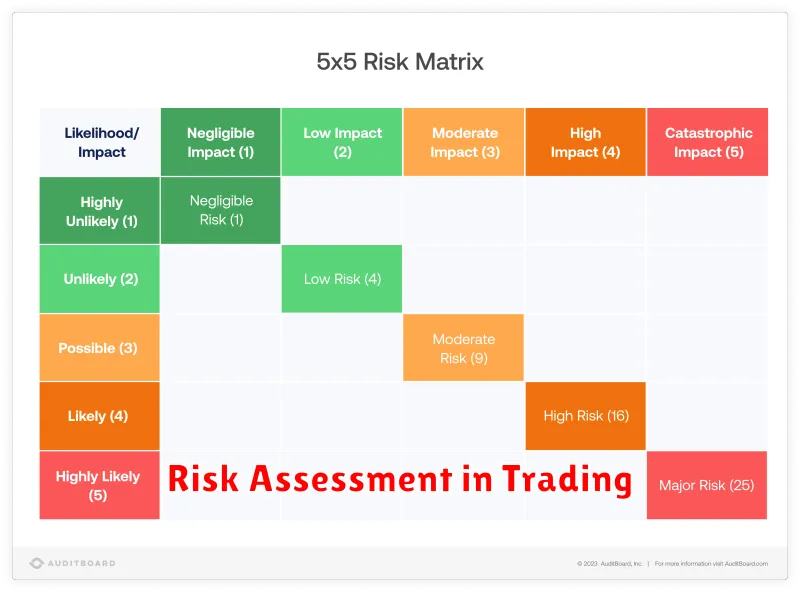
Risk assessment is paramount in trading. It involves identifying, analyzing, and mitigating potential losses before entering a trade. Ignoring this crucial step can lead to significant financial setbacks.
Identifying risks begins with understanding the market’s volatility and your chosen investment strategy. Factors such as economic indicators, geopolitical events, and company-specific news can all significantly impact your investments. Knowing your own risk tolerance—your ability to withstand potential losses—is equally important.
Analyzing risks requires evaluating the potential magnitude of losses and their probability. For example, a high-risk, high-reward trade might offer significant profits but also carries the potential for substantial losses. Diversification, spreading investments across different assets, helps reduce risk by not putting all your eggs in one basket.
Mitigating risks involves implementing strategies to limit potential losses. These include setting stop-loss orders, which automatically sell a security when it reaches a predetermined price, and diversifying your portfolio. Position sizing, determining the appropriate amount to invest in each trade, is another critical element of risk management.
Regularly reviewing and adjusting your risk management strategy based on market conditions and your trading performance is essential for long-term success. Thorough research and a disciplined approach are key to minimizing risks and maximizing potential returns.
Developing a Trading Plan
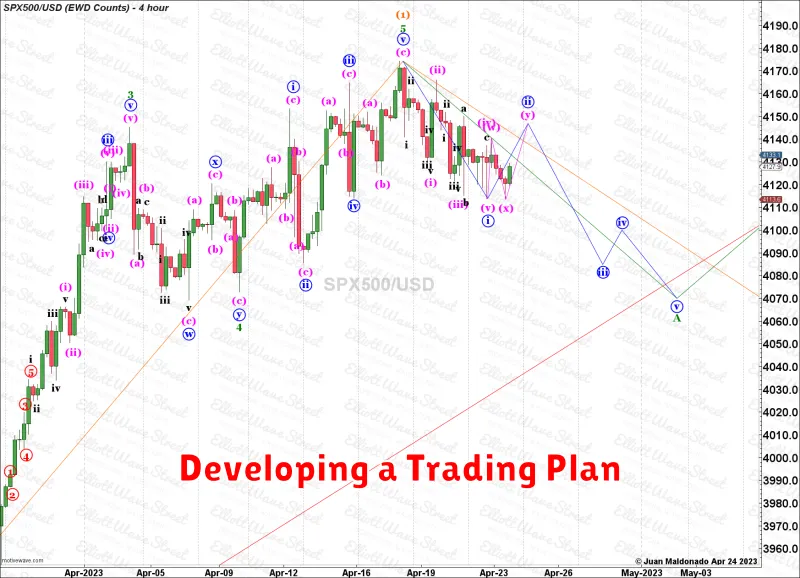
A well-defined trading plan is crucial for success in the stock market. It provides a structured approach, minimizing emotional decisions and maximizing potential profits. Consistency is key; a good plan should be followed regardless of market conditions.
Your plan should begin with clearly defining your trading goals. Are you aiming for long-term growth, short-term profits, or a combination? Determine your risk tolerance – how much are you willing to lose on any single trade or over a specific period? This will influence your investment choices and position sizing.
Next, identify your trading style. Will you focus on technical analysis (chart patterns, indicators), fundamental analysis (company financials), or a blend of both? Select specific strategies aligned with your style and risk tolerance. This could involve swing trading, day trading, or value investing, each demanding different levels of time commitment and expertise.
Risk management is paramount. Establish stop-loss orders to limit potential losses on each trade. Determine your position sizing – the percentage of your capital allocated to each trade. Diversification across multiple assets can further mitigate risk.
Finally, your plan should incorporate a record-keeping system. Track your trades, wins, losses, and overall performance. Regularly review and adjust your plan based on your results and market changes. This iterative process is essential for continuous improvement.
Monitoring Market Indicators
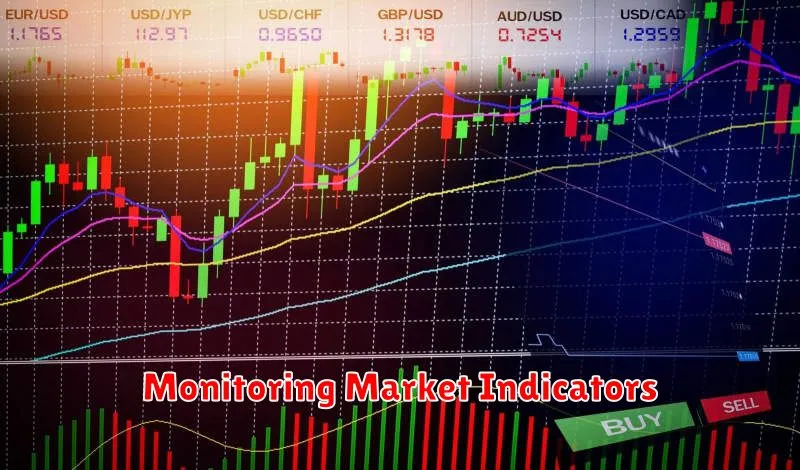
Monitoring key market indicators is crucial for successful stock trading. These indicators provide valuable insights into market trends and sentiment, helping traders make informed decisions.
Major indices such as the Dow Jones Industrial Average, S&P 500, and Nasdaq Composite offer a broad overview of market performance. Tracking their movements can reveal overall market direction.
Volume, representing the number of shares traded, provides context to price movements. High volume confirms price changes, while low volume suggests potential weakness.
Economic indicators like inflation rates, unemployment figures, and interest rate changes significantly impact market performance. Understanding their influence is essential.
Technical indicators, such as moving averages and relative strength index (RSI), offer signals based on price and volume data. These can provide insights into potential buy and sell opportunities.
Market breadth, measured by the advance-decline ratio, shows the proportion of stocks advancing versus declining. A widening gap between these indicates a strong trend, while a narrowing gap suggests indecision.
Effective monitoring involves utilizing various resources like financial news websites, charting software, and economic data providers. Consistent observation and analysis are vital for interpreting these indicators and their implications.